
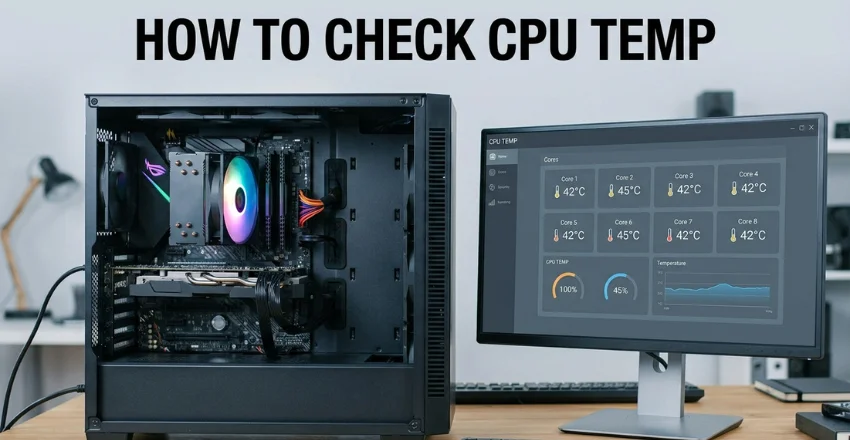
If you want to learn how to check CPU temp, Windows gives you several reliable options. Dedicated monitoring tools provide the most useful readings while your computer is running normally. You can also use BIOS or UEFI when you prefer a method that requires no extra software.
Quick answer: On Windows 11, the easiest route is HWiNFO or Core Temp. Open the sensor view, find CPU Package or Core Max, then watch current and maximum readings. BIOS or UEFI works without software, but it usually shows idle heat instead of temperatures during gaming.
| Method | Best use | Live readings under load? | Extra software? |
|---|---|---|---|
| HWiNFO | Detailed monitoring and troubleshooting | Yes | Yes |
| Core Temp | Simple per-core readings | Yes | Yes |
| AMD Ryzen Master | Supported Ryzen desktop processors | Yes | Yes |
| Intel XTU | Supported unlocked Intel systems | Yes | Yes |
| BIOS/UEFI | Quick no-download check | No | No |
Key Takeaways
- Windows Task Manager normally does not display processor temperature.
- HWiNFO and Core Temp provide live readings while games or applications are running.
- BIOS and UEFI can show temperature without installing a monitoring program.
- CPU Package and Core Max are useful readings on many Intel systems.
- AMD systems may show Tctl, Tdie, or a combined Tctl/Tdie reading.
- Compare temperatures with your exact processor’s documented thermal limit.
What You’ll Need Before Checking Processor Temperature
You only need your computer and access to its normal Windows account. Knowing your processor model also helps when comparing temperatures with manufacturer limits. A repeatable workload, such as a game, can show how cooling performs during real use.
Desktop owners may also want to review Techanta’s PC Builds section for related computing topics. Hardware temperatures make more sense when you consider airflow, cooling, case design, and workload together. Checking one idle number rarely tells the complete story.
How to Check CPU Temp in Windows 11
For most people, a live monitoring program gives the most useful result. It lets you watch temperature while Windows, games, browsers, or editing programs are running. Follow these steps before worrying about a single number.
- Choose a monitoring method. HWiNFO works well for detailed readings, while Core Temp keeps things simpler.
- Open the temperature sensors. In HWiNFO, use Sensors-only mode and start the sensor window.
- Find the processor reading. Look for CPU Package, Core Max, Core Temperatures, Tdie, or Tctl/Tdie.
- Run your normal workload. Keep the monitor open while gaming, editing, rendering, or performing the problem task.
- Check the maximum value. Compare the recorded peak with your specific processor’s documented thermal specification.
Method 1: Use HWiNFO for Detailed Sensor Readings
HWiNFO provides real-time monitoring for processors, graphics cards, motherboards, drives, and other hardware. Its sensor window can display current, minimum, maximum, and average values. The software supports modern Windows systems, including Windows 11.
Open HWiNFO and choose Sensors-only when the startup window appears. Scroll to the section carrying your processor’s model name. Check CPU Package or Core Max on many Intel computers.
AMD systems can expose several processor sensors with similar names. Tctl is associated with cooling control, while Tdie can represent die temperature on supported processors. Some Ryzen systems combine these readings as Tctl/Tdie.
Method 2: Use Core Temp for a Faster Check

Core Temp focuses on processor monitoring instead of displaying every system sensor. It can show the temperature of individual CPU cores and update those readings as workloads change. Its official site lists support for Windows 11 and recent Intel and AMD x86 processors.
The current Core Temp release listed in September 2026 is version 1.20.1. That release arrived in May 2026 and includes Ryzen temperature fixes. Open the program and watch its core readings while reproducing the workload you want to measure.
Method 3: Check an AMD CPU With Ryzen Master
Ryzen Master is AMD’s official monitoring and tuning program for supported Ryzen desktop platforms. Its current documentation lists a CPU Temperature gauge showing the processor’s current temperature. The application supports Windows 10 and Windows 11 on compatible systems.
Install Ryzen Master from AMD and open its monitoring view without changing tuning controls. Watch the temperature while your normal workload is active. AMD currently lists support around compatible AM4, AM5, and SP6 desktop platforms.
Method 4: Use Intel XTU on Supported Intel PCs
Intel Extreme Tuning Utility can monitor temperature, frequency, voltage, and several other processor values. Intel currently limits XTU support to specific unlocked processors and compatible platforms. Check compatibility before installing it, especially if you only need thermal monitoring.
After installation, open XTU and find the System Monitor area. On supported hardware, you can add temperature to the available monitoring parameters. Avoid changing voltage or frequency settings when your goal is temperature checking.
Method 5: Check CPU Temperature in BIOS or UEFI
BIOS or UEFI is the easiest option when you don’t want another Windows application. The reading is usually located under Hardware Monitor, PC Health, Monitor, or a similar menu. Its main limitation is that Windows and your normal applications are not running.
Windows 11 can restart directly into firmware settings on supported systems. Go to Settings > System > Recovery > Advanced startup > Restart now. Then select Troubleshoot > Advanced options > UEFI Firmware Settings > Restart.
BIOS measurements help spot serious cooling problems at startup. They are less useful for checking temperatures during games or demanding applications. Use a live Windows monitor when you need temperatures under load.
Can Task Manager Show CPU Temperature?
Windows Task Manager normally shows processor usage, speed, uptime, cores, and other performance information. It does not provide a standard CPU temperature field on current Windows 10 or Windows 11 systems. Temperature shown elsewhere in Task Manager is commonly associated with supported graphics hardware.
That difference causes confusion because both processor and graphics information appear under Performance. Opening Performance > CPU still helps identify your exact processor model. Use that model name when checking official thermal specifications.
Which CPU Temperature Reading Should You Watch?
Monitoring software may display several temperatures at the same time. Those readings can represent different sensors, averaging methods, or parts of the processor package. A difference between two sensor values does not automatically indicate a problem.
| Sensor label | What it generally represents | Useful for |
|---|---|---|
| CPU Package | Package-level processor reading | General Intel monitoring |
| Core Max | Hottest processor core | Finding peak core heat |
| Core # | Individual core sensor | Comparing cores |
| Tctl | AMD control temperature | Cooling and fan behavior |
| Tdie | AMD die temperature where available | Direct die monitoring |
| Tctl/Tdie | Combined reading when values match | General Ryzen monitoring |
HWiNFO’s author recommends CPU Package as a useful general Intel reading. Core Max represents the hottest execution core and can also help identify peaks. AMD labels vary by processor generation and firmware behavior.
What Is a Normal CPU Temperature?
There is no single ideal temperature for every processor. Cooling hardware, laptop size, room temperature, workload, and processor design all affect the reading. Intel specifically advises checking the thermal specification for the exact processor model.
| Workload | Common ballpark | Fahrenheit |
|---|---|---|
| Idle or light desktop use | 30°C to 50°C | 86°F to 122°F |
| Browsing and general work | 40°C to 70°C | 104°F to 158°F |
| Gaming or heavier work | 60°C to 85°C | 140°F to 185°F |
| Demanding sustained workloads | 75°C to 95°C | 167°F to 203°F |
Treat these figures as practical reference ranges, not universal limits. Modern processors can tolerate temperatures that would look high on older hardware. Some models deliberately boost close to their thermal limits during demanding work.
Intel says maximum junction temperature varies by product and commonly falls between 100°C and 110°C. Your exact specification matters more than a generic internet threshold. Look up your processor model before deciding a particular reading is unsafe.
How to Measure Temperature While Gaming
Start your monitor before launching the game you want to test. Play long enough to reproduce the heat, fan noise, or slowdown that concerns you. Then check the recorded maximum instead of relying only on the temperature after closing the game.
Temperature can fall quickly once a demanding workload stops. HWiNFO can also feed sensor information into supported on-screen display tools. That setup lets advanced users watch readings without leaving a full-screen application.
Checking Temperature on a Mac or Linux PC
macOS manages thermal behavior automatically and does not present processor temperature prominently in Activity Monitor. Apple recommends Activity Monitor when checking whether a process creates unusually high CPU activity. Apple also cautions against treating third-party sensor applications as hardware diagnostic tools.
Third-party Mac monitoring programs can still show available internal sensor information. Laptop owners should also keep vents clear and use stable surfaces with airflow. Techanta’s Panasonic Toughbook guide covers computing hardware designed for harsher environments.
Linux users commonly use the sensors command from the lm-sensors package. The command prints current readings exposed by supported sensor chips. Labels may include package, core, Tctl, Tdie, or hardware-specific names.
What to Do If the Processor Runs Too Hot
First, confirm the temperature with another trustworthy sensor reading when possible. Compare the maximum reading with the official limit for your exact processor. Persistent throttling, crashes, or temperatures near that limit deserve closer inspection.
- Check whether CPU and case fans are spinning normally.
- Remove dust from filters, heatsinks, fans, and ventilation openings.
- Make sure the laptop rests on a firm surface with clear vents.
- Confirm that the CPU cooler is mounted correctly.
- Replace aging thermal paste when cooler contact is suspect.
- Check whether background software is keeping processor usage unusually high.
- Review fan curves and cooling settings, and avoid aggressive overclocking.
Cooling upgrades can help systems that stay thermally limited during demanding workloads. Techanta also has a GPU water cooling guide covering liquid-cooling principles and hardware. CPU cooling parts differ, so always follow instructions for your exact cooler and processor socket.
Frequently Asked Questions
How to Check CPU Temp Without Installing Software
Restart the computer and enter its BIOS or UEFI firmware menu. Look for Hardware Monitor, PC Health, Monitor, or a similarly named page. Remember, this reading reflects a lightly loaded system, not gaming conditions.
Is 80°C Too Hot for a CPU?
An 80°C reading under a heavy workload is not automatically unsafe. Processor design and the manufacturer’s documented thermal limit determine how much headroom remains. The same temperature during idle use would deserve more investigation.
Why Is My Laptop CPU Hotter Than My Desktop?
Laptops fit processors, cooling hardware, batteries, and other components into much smaller spaces. Their cooling systems therefore have less room for large heatsinks and fans. Compare your laptop against its own normal behavior instead of a desktop computer.
Does a High Processor Temperature Slow Down a Computer?
Processors use thermal-control mechanisms when they approach their operating limits. Those protections can reduce frequency and power to control heat. Intel notes that thermal controls can reduce performance near Tjunction limits.
Keep a Baseline Instead of Chasing One Number
Check temperatures at idle, during normal work, and during your most demanding regular workload. Those three readings create a useful baseline for spotting future cooling changes. Sudden increases often matter more than small differences between two healthy systems.
For more PC maintenance and component topics, browse Techanta’s hardware guides. Recheck temperatures after cleaning, cooler work, or major hardware changes. A repeatable test gives you better information than guessing from fan noise.


